CATEGORY > Customer Health
Learn from Churn #2 – Number of Tickets vs Product Usage
This is a story of a SaaS customer success straight out of the trenches of my last startup. This is a part of my ongoing series (Learn From Churn) where I pick up churn stories and show you how we learned to be better at customer success.
Think of this as a whodunnit with a customer success theme where at the end we solve a mystery of a churn by looking at data. Last time I solved a case of catching inconsistent product usage as a cause of churn. You can read it here.
So, let’s see the next mystery: The Case of Tickets vs Product Usage
This was a mid-sized customer in the beautiful blue island of Sri Lanka with an ACV of $40,000. For all I knew, they were happy with us. And then, suddenly they came back saying that they were not happy with the issues and bugs that they kept finding in the system and would like to discard our solution.
This was highly surprising. They had logged less number of bugs and issues in our ticketing system compared to other happy similar-sized customers.
See the data set below:
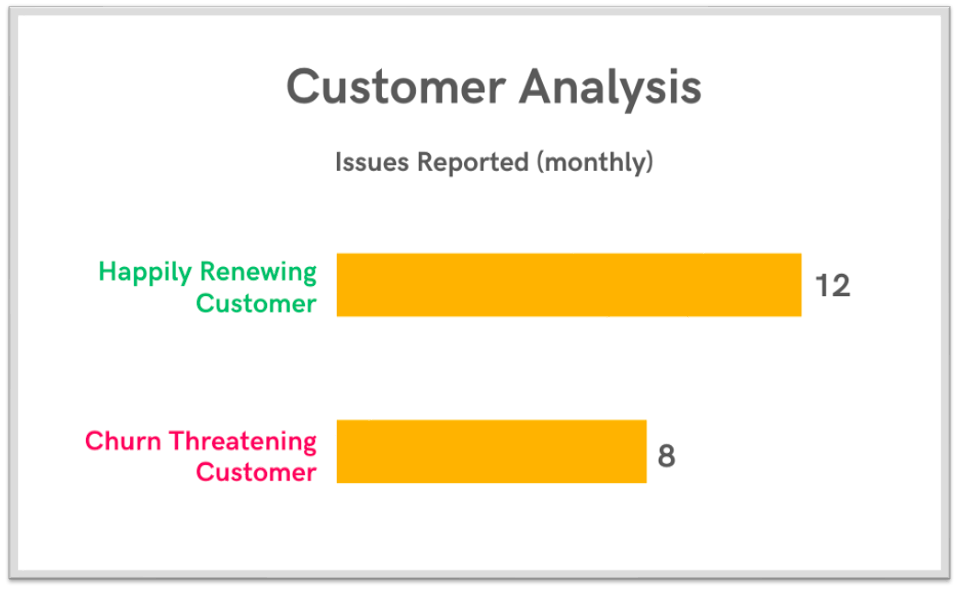
Even more bewildering, both of them only reported low and medium-priority bugs and issues that our customer support team resolved under the stipulated SLA.
Again, our customer success team interviewed the customer and found the underlying sentiment that became the key to resolving the issue. The unhappy customer reported that they “thought the product had too many issues when they used it”. The keyword of importance here was product use.
After a little digging, we found the answer.
Here is a quick comparison of the 2 customers. See if you can spot the customer issue?
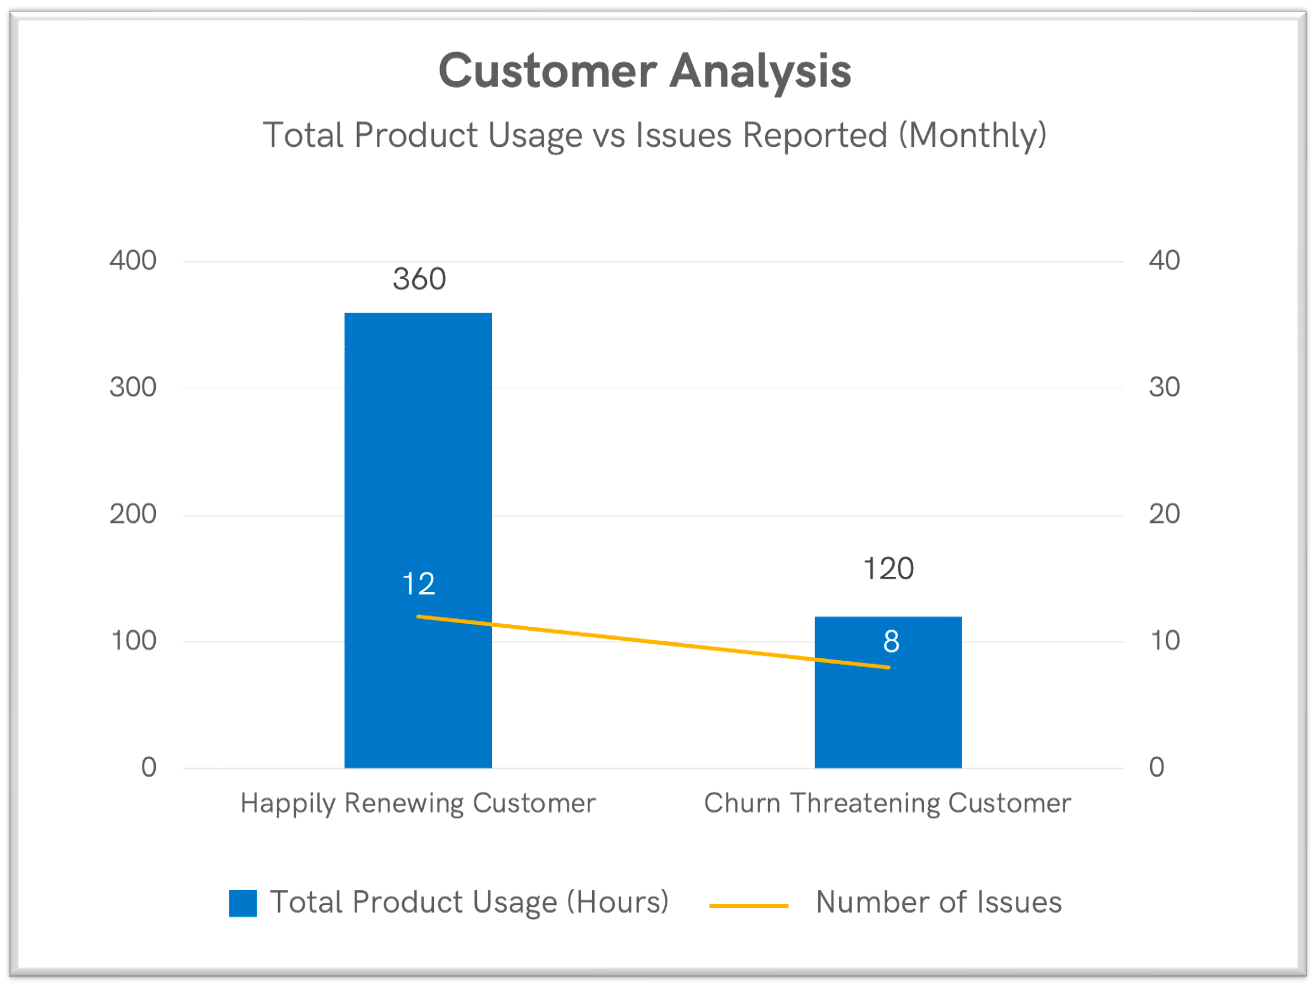
As you can see, the Churn Threatening Customer reported an issue for every 15 hours of product usage. However, the happy customer reported an issue every 30 hours of product usage.
The lesson was clear. It is not enough to just look at the number of issues, their resolution state, and their SLA met KPIs.
It was important to see how many hours of usage was creating a support ticket for this customer.
A customer who gets an issue every 15 hours is much more likely to be dissatisfied than a customer who reports an issue every 30 hours of product usage.
So, we added one more customer health KPI of support tickets raised per hour of product use by a customer. Again, we caught some customer pains early and prioritized their issues’ resolution to give them a better customer experience in product usage. The product management and the support team started looking at this KPI and it resulted in much better customer retention.
Learn from Churn: Lesson 2
A successful customer shows high usage with low issue reports.
In my next post, I will be giving an example of a churn threat where the customer’s feature request data showed us something really interesting! Stay tuned.
ABOUT THE AUTHOR

Popular from Customer Health
How ZapScale Uses AI to Calculate Customer Health and Predict Churn
ZapScale uses AI to calculate customer health scores, predicting churn with 94% accuracy and helping SaaS businesses identify upsell opportunities for growth.
18 November, 2024
The Ultimate Guide On Customer Health Score
Monitor Customer Health Score to spot at-risk accounts, drive adoption, and enhance upsell potential. Discover how to calculate and improve CHS for long-term success.
25 September, 2024
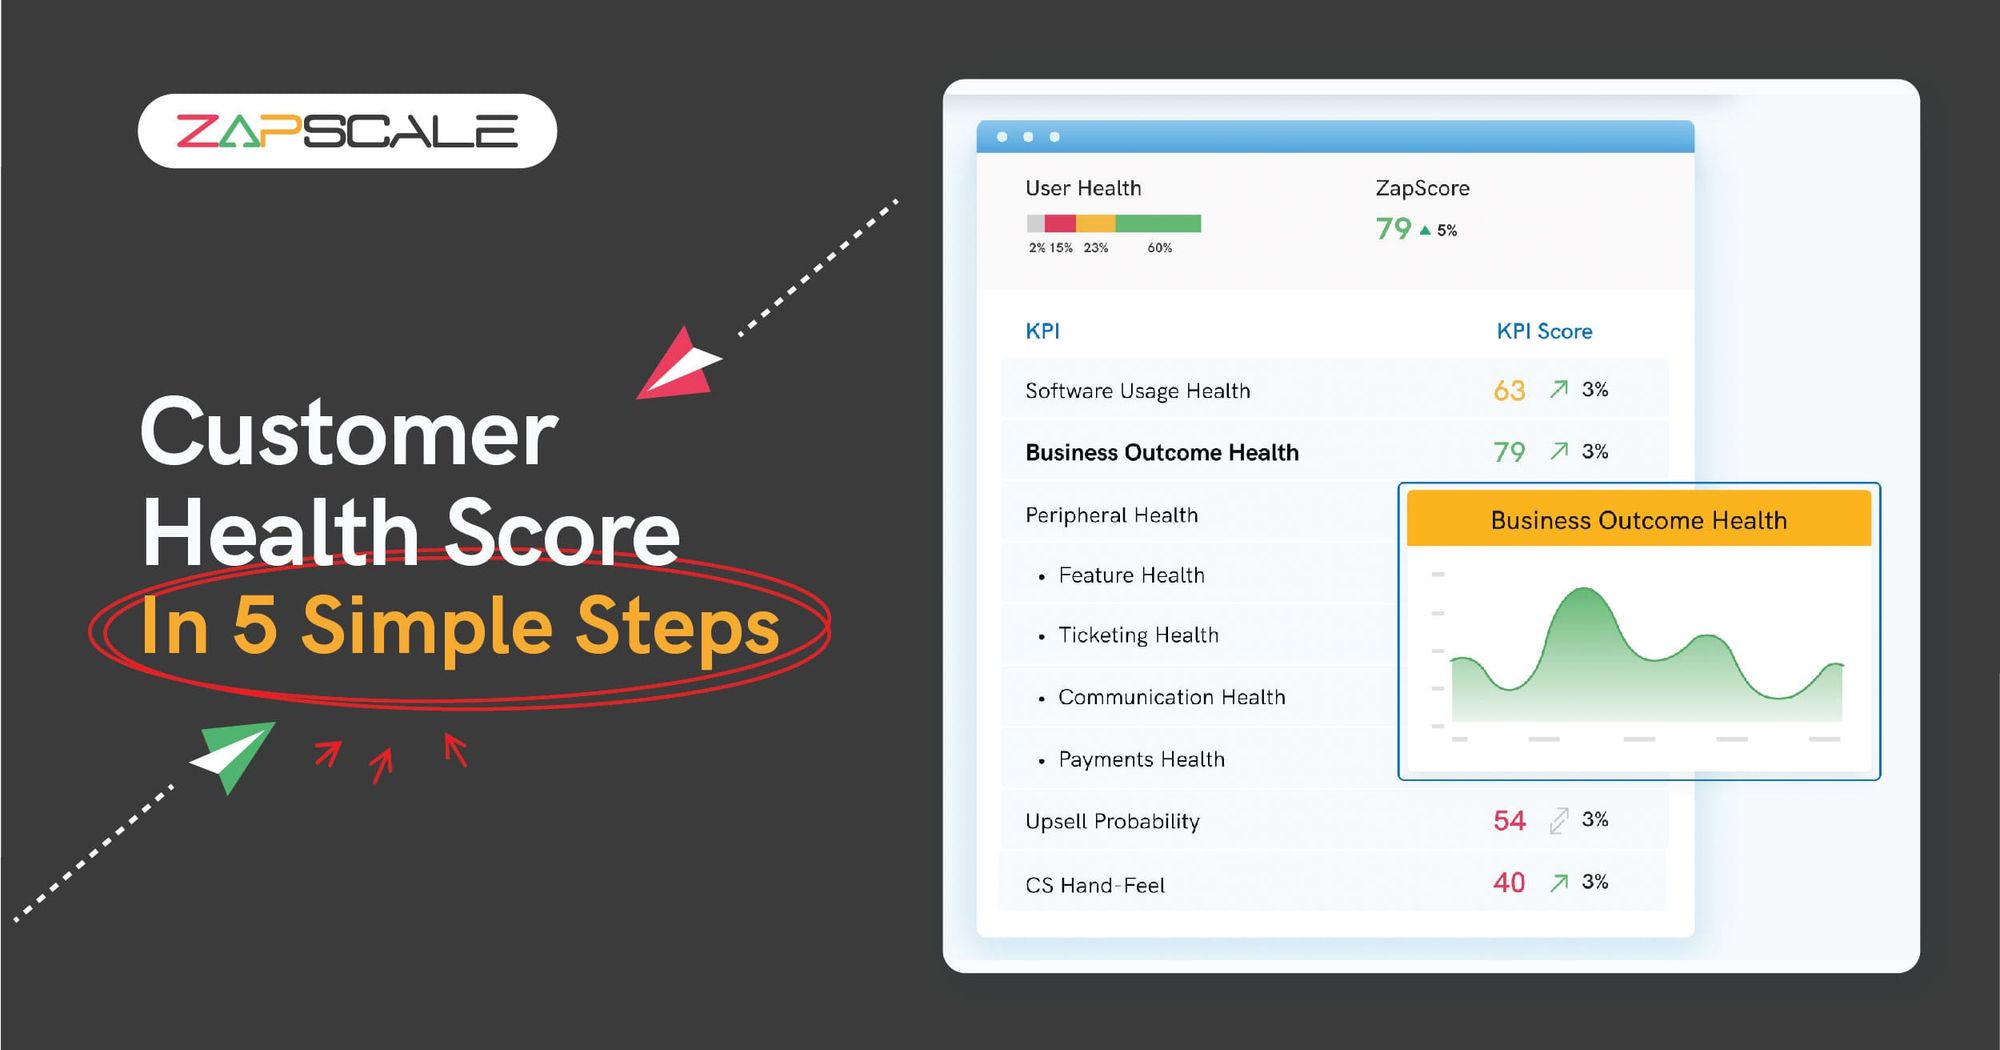
How To Build a Customer Health Score in 5 Simple Steps
Customer health isn't just another metric; it's a proactive tool for maintaining a thriving customer base. Discover the essential steps to create a robust Customer Health Score system with our comprehensive guide.
19 November, 2023

6 Vital Roles of a Customer Success Manager in a SaaS Company
Discover the crucial responsibilities that make a Customer Success Manager indispensable in a SaaS company. Uncover the 6 key roles they play in driving customer satisfaction, retention, and overall success.
27 June, 2023

Quality Content,
Straight To Your Inbox!
Subscribe for the latest blogs, podcasts, webinars, and events!

Write a Blog
If you have experience in CS and
a flair for writing, we’d love to
feature you.
Write to us on
hello@zapscale.com