CATEGORY > CS Metrics
Top 11 Customer Success Metrics That Actually Matter
What are CS Metrics?
In the past, we have spoken about how Customer Success efforts should focus or rather if done correctly, contribute not only to delight but also contribute as a revenue generation function. What’s important to understand here is how all of these efforts materialize into data or actionable insights to be able to make the decision-making process more efficient.
And even if these data points are collected, which ones should you focus on to drive a strategic impact on the larger Customer Success goals for an organization?
Simply put, CS metrics are key indicators of Customer Success that truly matter and give you a real pulse of how all your CS activities are performing, moving in the right direction, and if any changes need to be made on a strategic level to alter the results.
Why is it important to measure these metrics?
Measuring these data points has a multi-fold effect, as it helps with giving a comprehensive view of how CS is doing with respect to - customer satisfaction, improving products via concrete feedback, fostering loyalty, and driving business growth. It also gives you room to adapt to the evolving needs of the customers, and identify the areas where there is scope for change which overall results in building long-lasting relationships with customers - and isn’t that what we all want at the end of the day? A happy customer 🙂
Let's find out metrics that actually matter
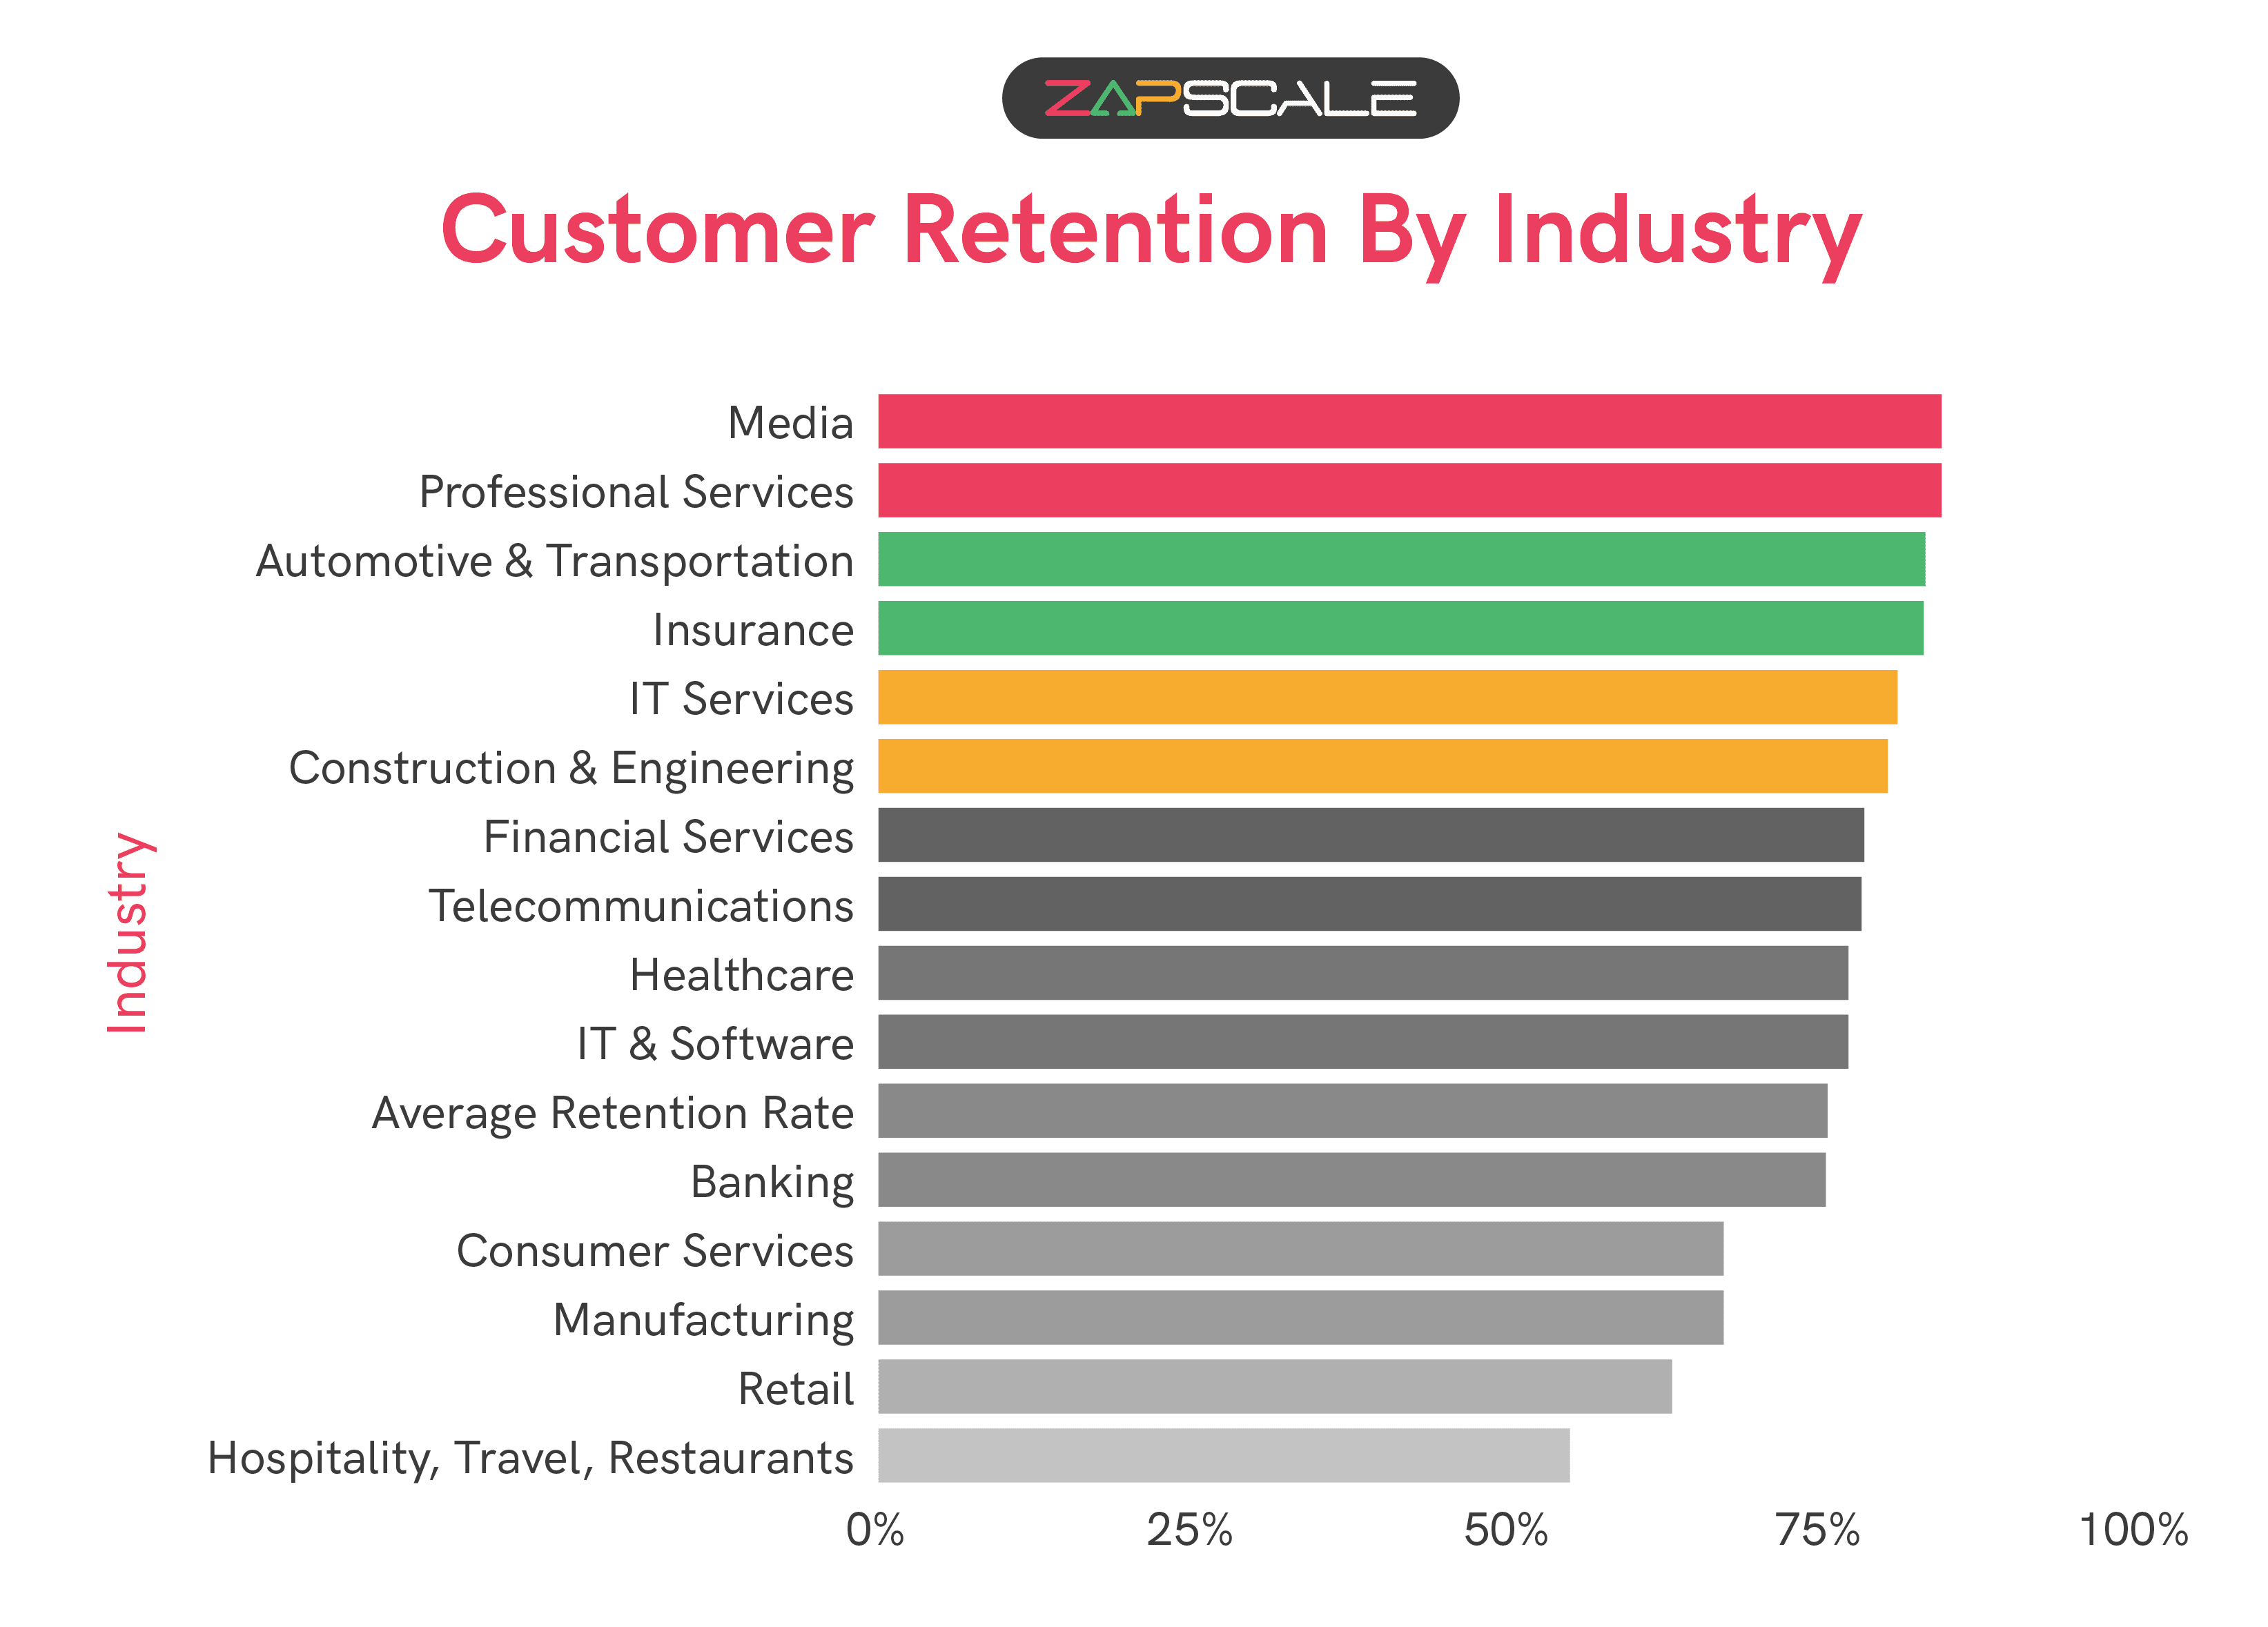
1. Customer Retention Rate (CRR) & Customer Retention Cost (CRC)
The customer retention rate measures the number of customers that renew or continue their engagement with you further than what they had signed up for.
Your product/service should address a pain point, preferably a solution to the problem faced by the masses (solution at scale) but having a strong product is not enough if the customers aren’t treated/understood well.
Customer retention should be the North Star metric as it defines the longevity of a sustainable business that is built on the foundations of customer retention and not solely on acquisition.
E = Number of customers at the end of the period
N = Number of new customers during the period
S = Number of customers at the start of the period
Cost of Retention = Total Retention Spend / Active Customers
And if you are wondering what are the costs/spends associated with it? Here they are;
- Customer Marketing
- Professional Services
- Customer Engagement
- Customer Adoption
- Account Management
- Customer Training
- Customer Success Teams
- Technologies
Customer retention cost will reduce over time but, say no to decreasing the cost rather than optimizing it better because reducing the cost would lead to compromising on customer experience.
2. Customer Health Score
As the name suggests, it is the metric to assess the overall well-being of the customer relationship. This is dependent and subjective to each organization or rather the product. It is a combined score of various other KPIs that one defines to aggregate into this number. This score should ideally be set up in such a manner that it is an indicator of important events in a customer lifecycle, such as onboarding completion, adoption, renewal, and potential expansion.
Alternatively, this score could also reflect the activity level of a customer to understand the involvement of your customer with the product(via support interactions or feature requests) on a daily/weekly/monthly basis.
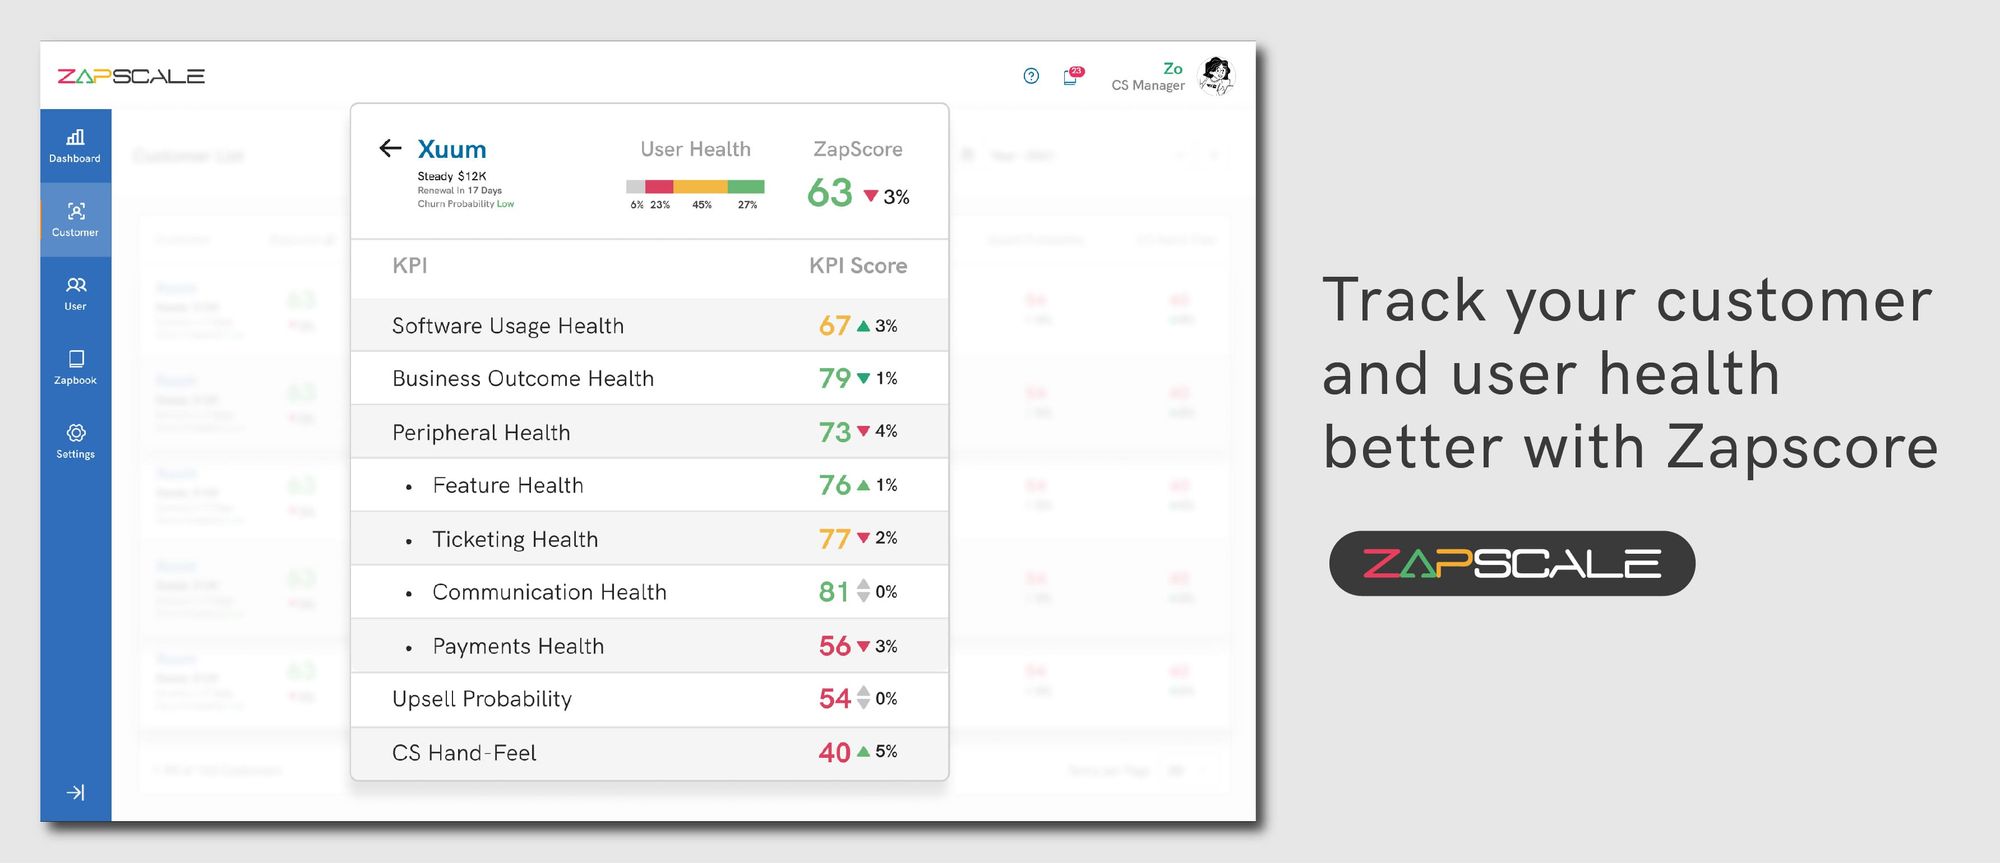
As you may understand, there is no set formula to get to this but what’s important to know is to identify what KPIs mean most to you and then set the health score according to the same. To sum it up, a Customer Health Score should be a metric that reflects the ongoing engagements of a customer allowing CSMs to know how to plan their day, prioritize efforts where required, and also interventions where they are needed the most.
3. Recurring Revenue
- ARR is Annual recurring revenue
- MRR is Monthly recurring revenue
The ARR is a reflection of what a company that offers a SaaS can expect on an annual basis. This helps an organization understand the stability of revenue and the consistent growth that is expected with this number.
The MRR on the other hand is a reflection of part of the ARR, ideally, it would be ARR/12, however the MRR at times could include a one-time upsell and not have the ‘recurring’ component. And so, it becomes important to define how one looks at MRR depending on the product and how the subscriptions are positioned.
ARR and MRR SaaS metrics types include:
- Acquisition - This additional component comes exclusively from acquiring new customers.
- Renewals - are from customers who decide to continue/renew their engagement.
- Expansion - Expansion ARR or MRR comes from customers who add features or additional products to the existing suite of offerings in their existing contract.
- Contraction – refers to the decrease in revenue by reducing the licenses or subscriptions of a product based on the usage of an organization or even economic factors that could affect an industry seasonally. This metric should not always be seen as a detractor, as logo retention also at times is a sign that customers wish to stay but are bound by constraints that are not always in their control.
4. Customer Churn
The churn/attrition rate is the rate at which your customers stop doing business with you. A simple example is your existing customers not renewing their subscriptions within a given time period. Churn is normal to happen as long as it is capped per your industry standards, the lower the better but it is very important to set a benchmark and raise alarms if the % crosses that.
It is also good to note, that churn is inevitable, how you and the business are equipped to:
- Predict its possibility
- Deal with the repercussions
becomes important in SaaS-based organizations, as Churn signifies a loss of revenue. A loss of revenue needs to be taken into account in order to run a business profitably/successfully.
How to Calculate Churn?
Churn measures how many customers stopped using your product or failed to renew. This can be monthly, quarterly, or annually based on your business model.
How to Reduce Churn?
Determine why it is happening by taking a close look at customers who are exiting the ecosystem. Assess data points like their demographics, age group, what marketing ads/content was shown to them etc and if this doesn’t lead to a conclusion then maybe send out an emailer to the churned clients and try and understand their reason for leaving.
Variables that can help reduce the Churn rate:
Better onboarding: Onboarding involves acquainting new customers with your product
Long-term pricing: Anuual sunscriptions can assist in retaining customers over the long term and ensuring recurring revenue.
Showcase your features: Every SaaS product has a core set of features their users use more than other.
Engagement: Focus on improving your user experience and resolving customer complains and queries as soon as they rise
Better cancel flows: When your customers are leaving you, you can make the most out of it by creating a proper customer offboarding process
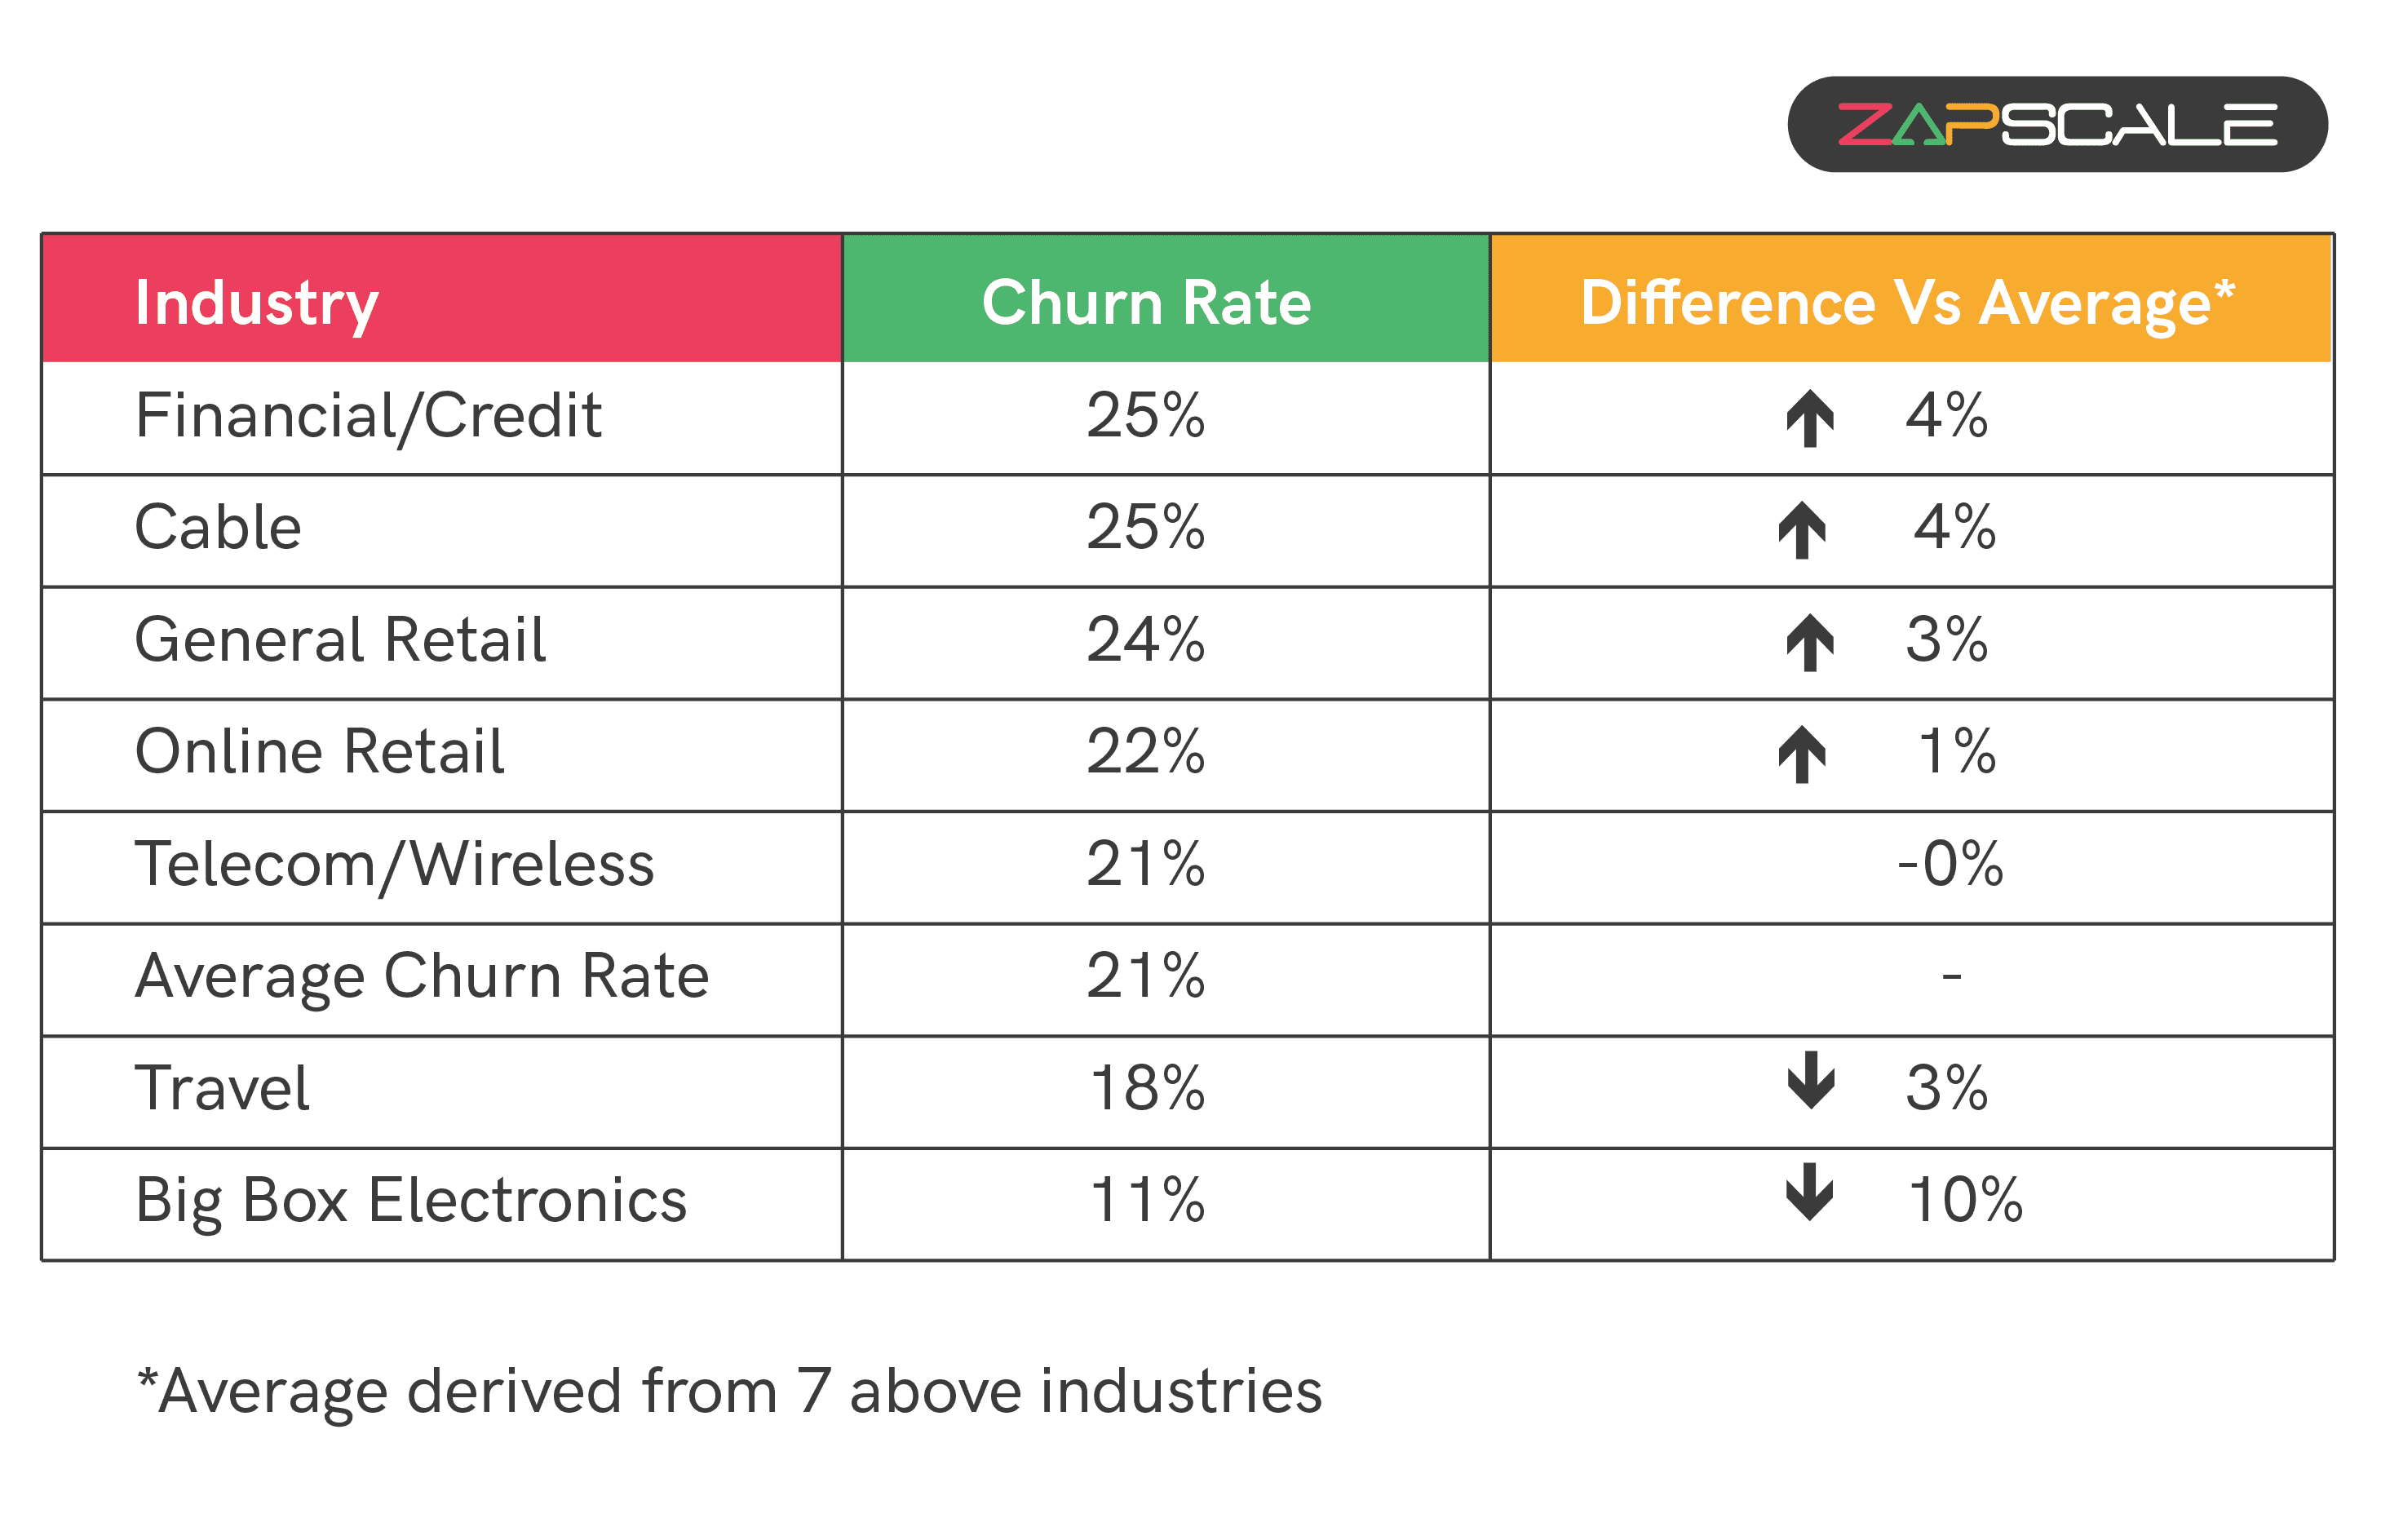
Here's a detailed look at US churn rater by industry:
5. Customer Lifetime Value
Customer lifetime value (CLV) is one of the key stats to track as part of a successful customer success strategy. Customer lifetime value is a measurement of how valuable a customer is to your company - across entire customer relationships.
It represents the total revenue a business expects to earn from a customer throughout their entire lifetime. Calculating CLTV helps SaaS companies understand the long-term value of acquiring and retaining customers.
Let's consider a hypothetical Sa
aS company that provides project management software on a subscription basis.
- Subscription Fee: The company charges $30 per month for its project management software.
- Average Customer Lifespan: On average, customers stay subscribed for 24 months.
- Additional Revenue Streams: The company also offers additional features or premium services that customers can purchase, generating extra revenue.
Now, let's calculate CLTV using the formula:
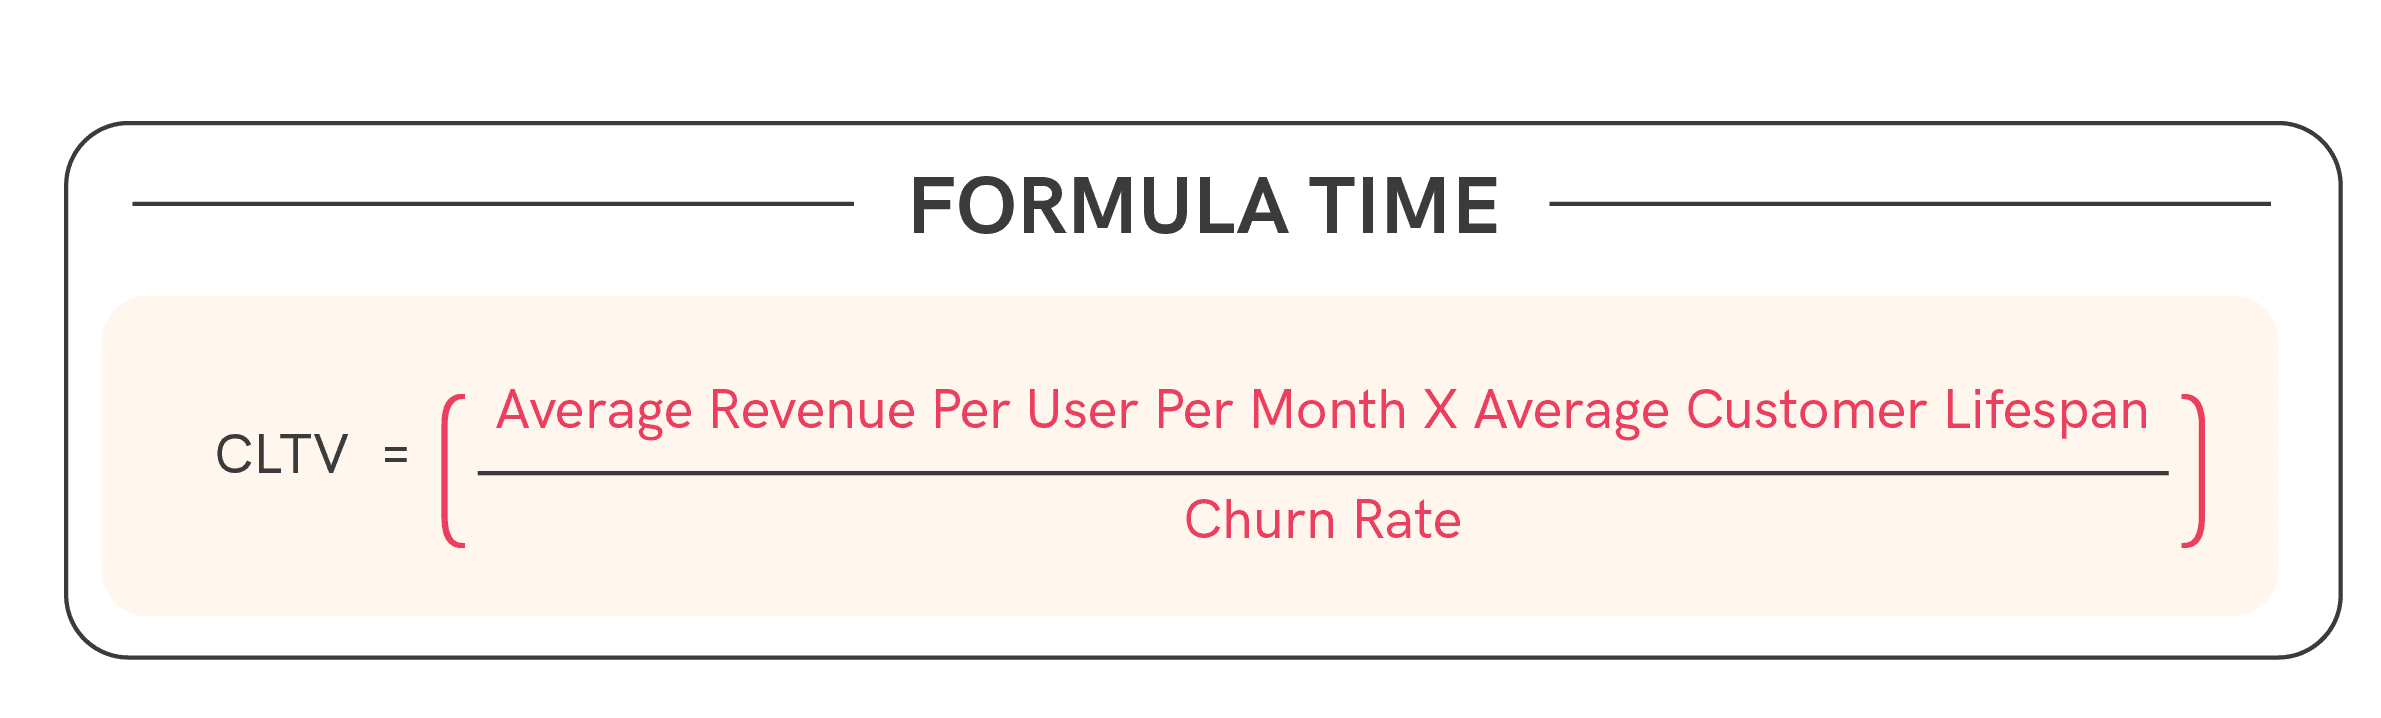
- he average revenue per user per month is $30.
- The average customer lifespan is 24 months.
- Assuming the churn rate (rate at which customers cancel subscriptions) is 20%.
So, the CLTV for each customer is estimated to be $3,600.
To summarise, this metric of CLTV helps SaaS companies make informed decisions about customer acquisition costs, marketing strategies, and product development to ensure the long-term profitability and sustainability of the business.
If the CLTV is high, it indicates that the company is doing well in retaining customers and extracting value from the relationship. If it's low, the company may need to focus more on improving customer retention or increase revenue from each customer(through additional services/features).
6. Customer Satisfaction Score
Is a metric used to measure how satisfied customers are with a product, service, or interaction. It is typically measured through surveys where customers are asked to rate their satisfaction on a scale, often ranging from 1 to 5 or 1 to 10. While it does showcase a data point, this metric falls in the category of qualitative rather than quantitative.
And the standard formula for calculating CSAT is as follows:
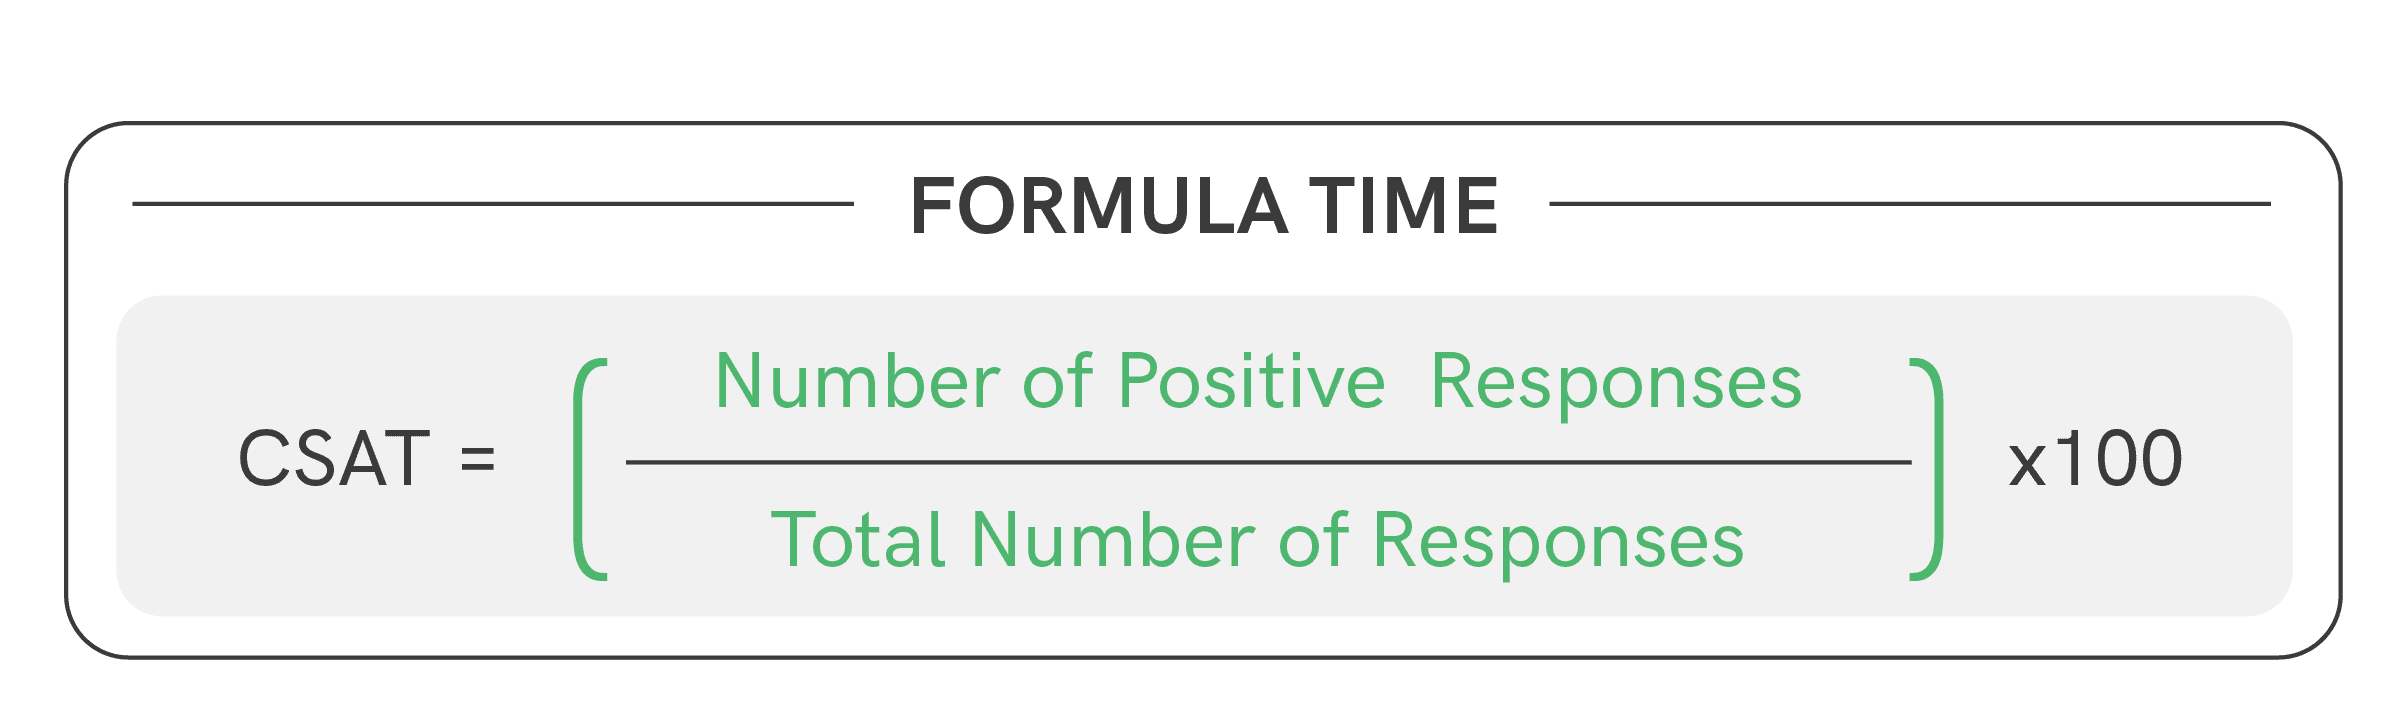
The customers will be comfortable to give a number on a range, but it shouldn’t stop there. It becomes important for CS teams to then engage in a discovery to gather more information around the feedback. This not only helps building a rapport with the clients but also makes the customer feel heard and get to the underlying sentiment with the account.
This feedback should then be broken down into actionable and shared with respective teams that can contribute to improving this score.
7. Net Promoter Score
Is a metric that measures the likelihood of customers recommending a company's product or service to others. It provides insights into overall customer satisfaction and loyalty. The NPS is based on a simple survey question:
Respondents typically provide a rating on a scale from 0 to 10, with 0 being "Not at all likely" and 10 being "Extremely likely." Based on their responses, customers are categorised into three groups:
- Promoters (Score 9-10): These are customers who are highly satisfied and are likely to recommend your product or service.
- Passives (Score 7-8): These customers are satisfied, but their loyalty is not as strong. They may not actively promote your product, and they could be swayed by competitors or can healthily be engaged to become promoters with the right nudge.
- Detractors (Score 0-6): These are customers who are dissatisfied and may not be the most reliable referral to recommend the product to anyone.
Net Promoter Score (NPS) in the SaaS industry is crucial because it quantifies customer loyalty, predicts growth, and helps SaaS companies identify promoters who can drive positive word-of-mouth referrals.
8. Customer Effort Score
Customer Effort Score (CES) measures the ease with which customers can achieve their goals when interacting with a product or a platform. It is also assessed through a survey asking customers how easy or difficult it was to accomplish a specific task. Responses are often on a scale, and the average score provides the CES. Lower scores indicate higher ease.
In Customer Success, CES is utilised to identify friction points in the customer journey. A lower effort score suggests a smoother experience, correlating with higher satisfaction and loyalty.
9. Renewal Rate (Expansion and Contraction Revenue)
It is the metric that measures the percentage of customers who renew their subscriptions at the end of a specific period. This is very critical in CS as all efforts that go in during the engagement period/contract period with the customer, stands at a true test at the time of renewals.
Renewal could be a matter of no discussion too, if the CS actions are set in such a manner that a renewal is nothing but obvious. Unless of course, there are reasons/constraints beyond your control like Industry dynamics, Economic stability, Competitive landscape etc
If I had to simply put it, the customer will renew with you if
✅ They are satisfied with the product – like the features, ease of use, performance and overall engagement capability.
✅ They are satisfied with the support – if the customer support team builds a relationship and they can get their queries resolved.
✅ They are satisfied with the value proposition - it solves for their problem.
Now, renewals can add or even subtract from revenue. Let me explain briefly :
If a renewal goes through with a 10% hike justified with product development and enhanced quality of output/engagement for the customer – this is will add to the revenue.
If a renewal for some reason cannot bear additional cost but the customer is ready to and wishes to stay with you and has budget constraints, you then decide to craft a proposal for them in such a manner that the customer features get limited, the customer gets utility for what they wish, leading to a reduction from the existing contraction revenue.
This is not all bad. Retaining customers and being with them on their journey yields more long term benefits that you may not see immediately. It is always a strategic call one has to take wisely. Retaining an important logo at times, could prove handy for your positioning and bring back the lost revenue in many folds.
10. Cost of Customer Onboarding
Refers to the expenses associated with acquiring and integrating a new customer onto the SaaS platform. It includes various activities and resources needed to help customers get started with the product or service and derive value from it. This helps organisations to optimize their operations and maximize the return on investment.
Broadly these costs include – sales & marketing efforts (personnel & campaigns), costs associated with tools that enhance this journey (internal & external), trainings costs, engagement cost (CS team activities) and many smaller pieces that contribute to this metric.
The COC is important for leaders in strategic positions to be aware of the components contributing to this and how this can be reduced and the output be maximized in order for the ROI both for the customer and for the tool is favourable.
In one of our podcasts below, Customer Onboarding Expert Donna Weber highlights the Cost of Customer Onboarding and the right way to calculate it.
An efficient and happy onboarding experience plays a big part in contributing to solidifying the customer relationship ultimately leading to loyalty and advocacy and thereby ultimately to revenue contribution.
11. Product Adoption Cost
Is a metric that reflects the percentage of users or customers who have started using a particular product or feature within a given time frame.
It is calculated by dividing the number of users who have adopted the product by the total number of users and then multiplying by 100 to express the result as a percentage.
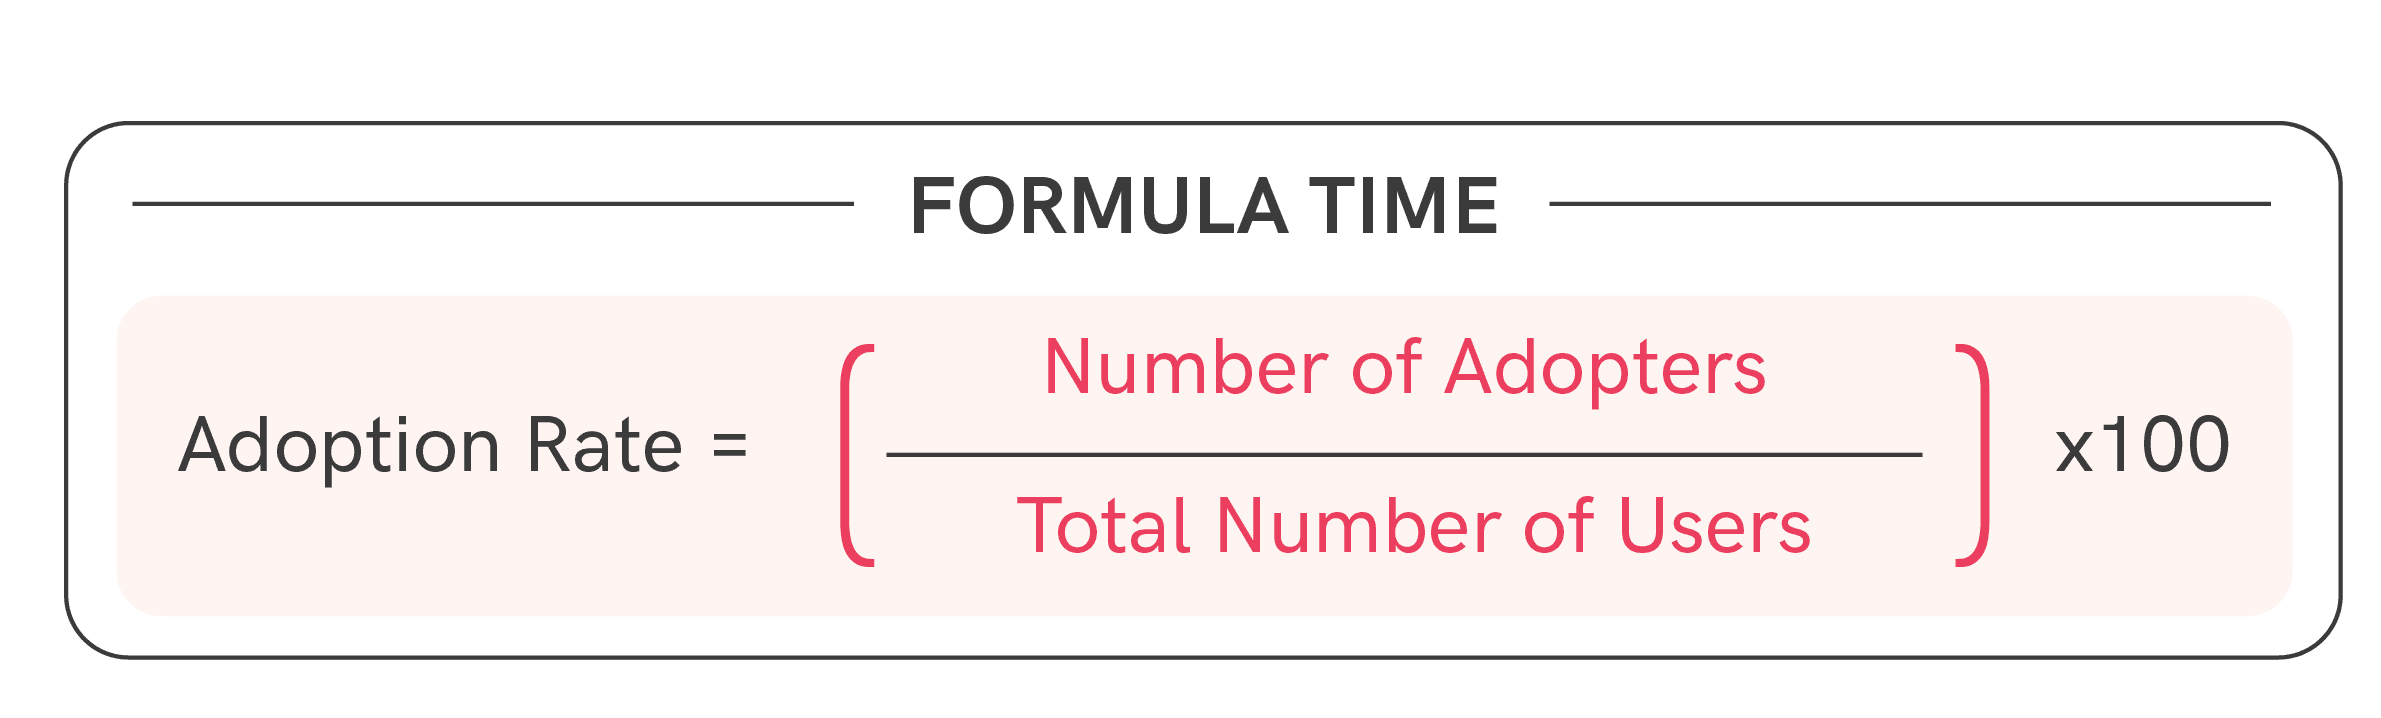
Example:
Suppose your company launches a new feature, and in the first month, 500 out of 1,000 users start actively using this feature.
- The number of adopters is 500 (users who started using the new feature)
- The total number of users is 1,000.
So, the adoption rate for the new feature is 50%.
A higher product adoption rate is generally indicative of successful product introduction and user engagement.
However, it is very important to note here that the product adoption can be measured or understood over time (e.g., monthly, quarterly) or for even a particular aspect of the product (e.g., overall product adoption or adoption of specific features). This is again defined at an overall org level depending on the product, the market it serves and the industry it is in.
Product adoption signifies the relevancy of the product at the present time. And so it becomes important to stay relevant, develop features based on feedback and adoption and enhance the customer experience that ultimately leads to them being with you for long.
Conclusion
In order to effectively understand how your business/product is performing, it is crucial to identify which metrics apply to your function as they will provide the insights for you to move in the direction that is needed to enhance the output. These metrics also help in understanding the loyalty, satisfaction and overall business performance.
By having the right metrics in place, they also serve in making data-driven decisions, thus showcasing the customer-centric approach of the organisation. Which then also builds credibility of your product and as always with all things CS, the right ripple effect is created, setting everyone up for success.
ABOUT THE AUTHOR

Popular from CS Metrics

NPS vs. CSAT: Which Metric Delivers the Best Customer Insights?
Explore the distinctions between NPS and CSAT metrics and their importance for customer retention and sustained success in the SaaS sector.
17 October, 2024

Your Practical Playbook for Customer Success OKRs
Customer success OKRs are a key to SaaS business growth, that enables data-driven decisions and track metrics like customer satisfaction and retention.
30 June, 2024
Time to Value (TTV): The Success Formula for SaaS businesses
Learn and discover strategies to reduce Time To Value ( TTV) enhance customer retention and satisfaction in SaaS businesses.
20 May, 2024

What is Customer Effort Score? How does it compare with CSAT and NPS?
Customer Effort Score (CES) measures the ease with which customers can achieve their goals when interacting with a product or a platform. Find out how it differs from NPS and CSAT.
19 November, 2023

Quality Content,
Straight To Your Inbox!
Subscribe for the latest blogs, podcasts, webinars, and events!

Write a Blog
If you have experience in CS and
a flair for writing, we’d love to
feature you.
Write to us on
hello@zapscale.com